Golf Club Distance Chart (By Swing Speed and Skill Level)
Golf club distance chart guides are one of the most searched tools in golf, and for good reason. Knowing how far each club goes helps with club selection, course management, and confidence over the ball. But a chart is only useful if you understand what it represents and what it does not.
There’s nothing worse than flushing your shot and it being 15 yards too short because you’ve selected the wrong club. I want to walk you through how distance charts work, what affects your numbers, and how to put them to good use on the course.
What Is a Golf Club Distance Chart?
A golf club distance chart shows the average carry or total distance for each club in the bag, usually from driver down to wedges. These charts are based on launch monitor data, GPS data capture or Tour averages.
Most charts will list distances like this:
- Driver
- Fairway woods
- Hybrids
- Irons
- Wedges
The key word here is average. A chart is not a promise. It is a reference point that helps you understand gapping and expectations.
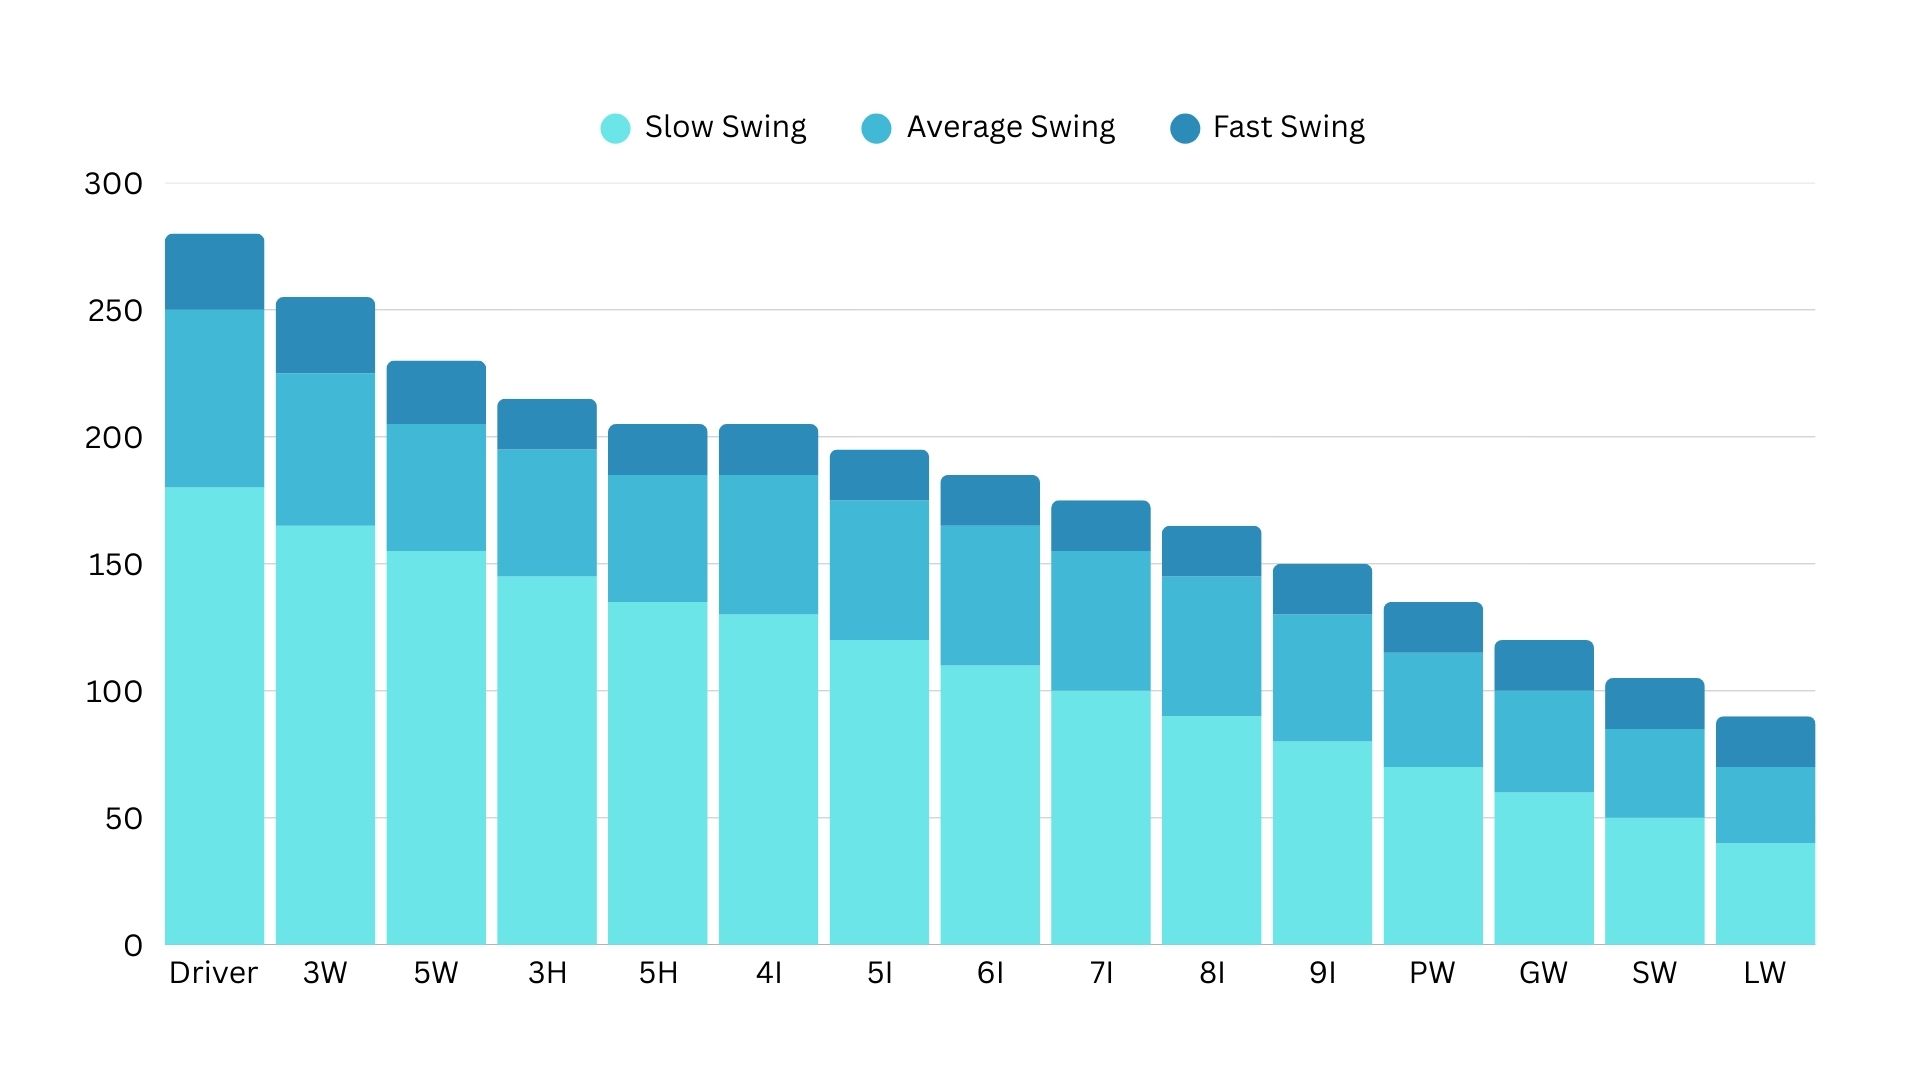
Golf Club Distance Chart
This golf club distance chart shows average carry distances for different swing speeds. These numbers are not targets to chase. They are reference points to help with club selection and gapping.
Swing speed categories are based on driver speed:
- Slow swingers: under 85 mph
- Average swingers: 85 to 100 mph
- Fast swingers: 100 to 110 mph
- Pros: 110+ mph
Woods and Hybrids
| Club | Slow Swing | Average Swing | Fast Swing | Pros |
|---|---|---|---|---|
| Driver | 180 | 240 | 280 | 290 |
| 3 Wood | 165 | 215 | 240 | 270 |
| 5 Wood | 150 | 205 | 225 | 255 |
| 3 Hybrid | 145 | 195 | 215 | 240 |
| 4 Hybrid | 135 | 185 | 205 | 225 |
Irons
| Club | Slow Swing | Average Swing | Fast Swing | Pros |
|---|---|---|---|---|
| 4 Iron | 130 | 185 | 205 | 225 |
| 5 Iron | 120 | 175 | 195 | 215 |
| 6 Iron | 110 | 165 | 185 | 205 |
| 7 Iron | 100 | 155 | 175 | 195 |
| 8 Iron | 90 | 145 | 165 | 180 |
| 9 Iron | 80 | 130 | 150 | 165 |
Wedges
| Club | Slow Swing | Average Swing | Fast Swing | Pros |
|---|---|---|---|---|
| Pitching Wedge | 70 | 115 | 135 | 150 |
| Gap Wedge | 60 | 100 | 120 | 135 |
| Sand Wedge | 50 | 85 | 105 | 120 |
| Lob Wedge | 40 | 70 | 90 | 100 |
How to Use This Chart Properly
Treat this chart as a baseline, not a benchmark. If your numbers are shorter or longer, that does not mean anything is wrong. What matters is consistency and knowing your own carry distances.
Focus on the clubs where distance gaps overlap. That is where most scoring mistakes happen.
Why Your Distances Might Not Match the Chart
If your 7 iron does not go the same distance as a chart you found online, that is completely normal. Several factors influence how far you hit each club.
Swing speed plays a big role. Faster swing speeds generally produce more distance, but only if contact is solid. Club loft variances between manufacturers or sets can alter your distances too.
Quality of strike matters just as much. A centered strike with a smooth swing and good ball compression will often travel further than a harder swing with poor contact.
Loft and club design also come into play. Modern irons are often stronger lofted than older sets, which can make distance charts feel misleading if you are comparing different eras or models.
Course conditions matter too. Temperature, wind, turf firmness, and altitude all affect how far the ball flies and rolls.
Golf Club Distance Chart vs Real World Golf
A golf club distance chart is best used as a starting point, not a rulebook. On the course, you are dealing with uneven lies, elevation changes, and pressure. That is why smart golfers learn their carry distances first, then adjust.
Carry distance is especially important when hitting over hazards or into greens. Total distance can vary a lot depending on rollout, especially with longer clubs.
If you know your 8 iron carries 135 yards but sometimes rolls out to 145, you can make better decisions depending on the course and conditions.
How to Build Your Own Distance Chart
The most accurate chart is one based on your own swing.
Start by hitting shots on a launch monitor if you have access to one. Focus on average carry distance, not your longest shot.
If you do not have a launch monitor, use the range and the course together. Pick a target, hit several balls, and pay attention to where solid strikes finish.
Be honest with your numbers. Do not base your chart on perfect strikes only. Golf is about repeatable results, not highlights.
Once you have your distances, write them down or save them on your phone. That personal chart will be far more useful than anything generic.
Using a Distance Chart to Lower Scores
Distance charts help most with club selection and confidence. When you know your numbers, indecision disappears.
Instead of standing over the ball guessing between clubs, you commit to a shot. That alone can save strokes.
Charts also help identify gapping issues. If two clubs go the same distance, or there is a big gap between irons, it may be worth adjusting lofts or changing a club.
Conclusion
A golf club distance chart is a helpful tool, but it works best when paired with self awareness. Charts give context, not certainty. Learn your own distances, understand why they change, and use that knowledge to make smarter decisions on the course.
Remember, a chart should guide your thinking, not override your experience.
Frequently Asked Questions
Are golf club distance charts accurate?
They are accurate as averages, not absolutes. They reflect typical distances, not what every golfer will hit.
Should I focus on carry or total distance?
Carry distance is usually more important, especially when hitting into greens or over hazards.
Do beginners need a distance chart?
Yes. Even a rough chart helps beginners understand gapping and avoid consistently coming up short or long.
Why do modern irons go further than older irons?
Stronger lofts and improved club design have increased distance. A modern 7 iron may have the same loft as an older 6 iron.